2.Kaggle比赛 Optiver Realized Volatility Prediction 1 1. 比赛数据解释 举办方 Optiver 提供了一个notebook来介绍数据和股票交易数据Introduction to financial concepts and data 。
这里只介绍给的几个公式:
BidAskSpread , 反映该股票流通性,
Weighted averaged price , 表示股票估值,
log returns , 计算该股票某个时间段的差值,
其中,代表两个时间点,如看作昨天和今天两个点。
Realized volatility ,实际波动率,
In this competition, you will be given 10 minutes of book data and we ask you to predict what the volatility will be in the following 10 minutes.
接下来我会按照 alexioslyon的lgbm-baseline 来解释下baseline。所有代码,按照其调用顺序解释,这会跟源notebook代码顺序有些差别。
另外df的展示基本是部分的,特征非常多。
2. book,trade数据特征工程 1. 读取train/test data 1 2 3 4 5 6 7 8 9 def read_train_test_data (): """读取数据""" train = pd.read_csv(data_dir + 'train.csv' ) test = pd.read_csv(data_dir + 'test.csv' ) train['row_id' ] = train['stock_id' ].astype(str ) + '-' + train['time_id' ].astype(str ) test['row_id' ] = test['stock_id' ].astype(str ) + '-' + test['time_id' ].astype(str ) print (f'Out training set has {train.shape[0 ]} rows' ) return train, test
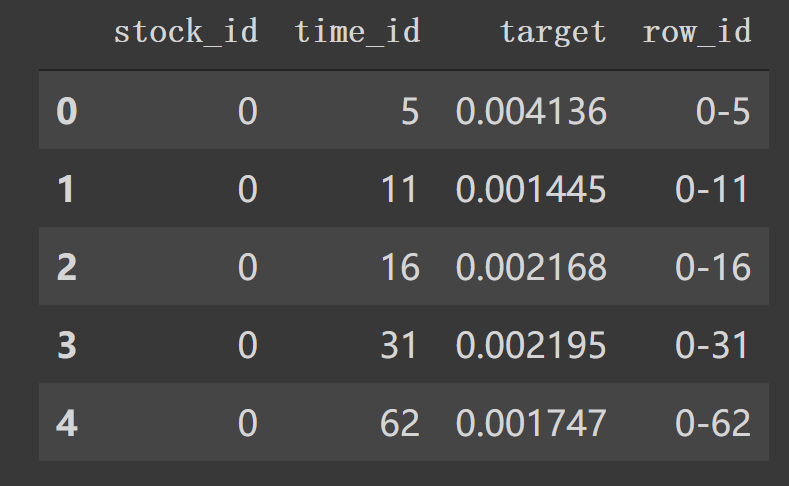
这里主要就读取train, test,和构建新的row_id.形成如下df.
现在我们可以通过 train_stock_id = train['stock_id'].unique()得到唯一的 stock_id.
2. 预处理核心方法 像如下调用中,使用下面 preprocessor(list_stock_ids, is_train=True)。
1 2 3 train_stock_id = train['stock_id' ].unique() train_ = preprocessor(train_stock_id, is_train=True ) train = train.merge(train_, on=['row_id' ], how='left' )
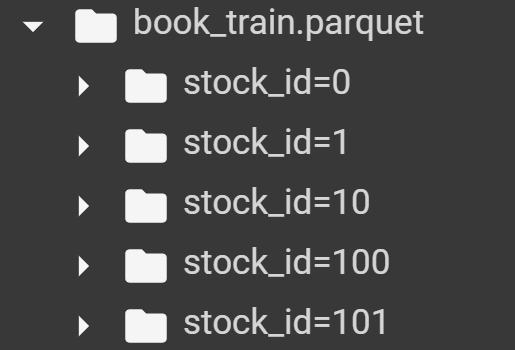
file_path_book对应路径如下图:
现在我们只读到如下 13行book_preprocessor(file_path_book), trade_preprocessor(file_path_trade)这部分代码。现在要看 book_preprocessor这些函数具体处理细节了。
1 2 3 4 5 6 7 8 9 10 11 12 13 14 15 16 17 18 19 def preprocessor (list_stock_ids, is_train=True ): def for_joblib (stock_id ): if is_train: file_path_book = data_dir + r'book_train.parquet/stock_id=' + str (stock_id) file_path_trade = data_dir + r'trade_train.parquet/stock_id=' + str (stock_id) else : file_path_book = data_dir + r'book_test.parquet/stock_id=' + str (stock_id) file_path_trade = data_dir + r'trade_test.parquet/stock_id=' + str (stock_id) df_tmp = pd.merge(book_preprocessor(file_path_book), trade_preprocessor(file_path_trade), on='row_id' , how='left' ) return df_tmp df = Parallel(n_jobs=-1 , verbose=1 )(delayed(for_joblib)(stock_id) for stock_id in list_stock_ids) df = pd.concat(df, ignore_index=True ) return df
3. book_preprocessor逐行分析 在 book_preprocessor中读取得到df如下。1 2 df1 = pd.read_parquet('/data/book_train.parquet/stock_id=0' ) df1.head()
对应着类似第6行中 file_path_book。我们看看在book_preprocessor未处理的df。
如上图,我们看到 book_train.parquet/stock_id=0得到的df有 'time_id', 'ask_price1' 等等特征列。1 2 3 4 5 6 7 8 9 10 11 12 13 14 15 16 17 18 19 20 21 22 23 24 25 26 27 28 29 30 31 32 33 34 35 36 37 38 39 40 41 42 43 44 45 46 47 48 49 50 51 52 53 54 55 56 57 58 59 60 61 62 63 64 65 66 67 68 69 70 71 72 73 74 75 76 77 78 79 80 81 82 83 84 85 86 87 88 89 90 91 92 93 def book_preprocessor (file_path ): """book数据预处理: 处理得到各个特征 """ df = pd.read_parquet(file_path) df['wap1' ] = calc_wap1(df) df['wap2' ] = calc_wap2(df) df['wap3' ] = calc_wap3(df) df['wap4' ] = calc_wap4(df) df['log_return1' ] = df.groupby(['time_id' ])['wap1' ].apply(log_return) df['log_return2' ] = df.groupby(['time_id' ])['wap2' ].apply(log_return) df['log_return3' ] = df.groupby(['time_id' ])['wap3' ].apply(log_return) df['log_return4' ] = df.groupby(['time_id' ])['wap4' ].apply(log_return) df['wap_balance' ] = abs (df['wap1' ] - df['wap2' ]) df['price_spread' ] = (df['ask_price1' ] - df['bid_price1' ]) / ((df['ask_price1' ] + df['bid_price1' ]) / 2 ) df['price_spread2' ] = (df['ask_price2' ] - df['bid_price2' ]) / ((df['ask_price2' ] + df['bid_price2' ]) / 2 ) df['bid_spread' ] = df['bid_price1' ] - df['bid_price2' ] df['ask_spread' ] = df['ask_price1' ] - df['ask_price2' ] df['bid_ask_spread' ] = abs (df['bid_spread' ] - df['ask_spread' ]) df['total_volume' ] = (df['ask_size1' ] + df['ask_size2' ]) + (df['bid_size1' ] + df['bid_size2' ]) df['volume_imbalance' ] = abs ((df['ask_size1' ] + df['ask_size2' ]) - (df['bid_size1' ] + df['bid_size2' ])) create_feature_dict = { 'wap1' :[np.sum , np.std], 'wap2' :[np.sum , np.std], 'wap3' :[np.sum , np.std], 'wap4' :[np.sum , np.std], 'log_return1' : [realized_volatility], 'log_return2' : [realized_volatility], 'log_return3' : [realized_volatility], 'log_return4' : [realized_volatility], 'wap_balance' : [np.sum , np.max ], 'price_spread' : [np.sum , np.max ], 'price_spread2' : [np.sum , np.max ], 'bid_spread' : [np.sum , np.max ], 'ask_spread' : [np.sum , np.max ], 'total_volume' : [np.sum , np.max ], 'volume_imbalance' : [np.sum , np.max ], 'bid_ask_spread' : [np.sum , np.max ], } create_feature_dict_time ={ 'log_return1' : [realized_volatility], 'log_return2' : [realized_volatility], 'log_return3' : [realized_volatility], 'log_return4' : [realized_volatility], } def get_stats_window (fe_dict, seconds_in_bucket, add_suffix=False ): """按时间段以及time_id聚合特征,bucket:时间段""" df_feature = df[df['seconds_in_bucket' ] >= seconds_in_bucket]\ .groupby(['time_id' ]).agg(fe_dict).reset_index() df_feature.columns =['_' .join(col) for col in df_feature.columns] if add_suffix: df_feature = df_feature.add_suffix('_' + str (seconds_in_bucket)) return df_feature df_feature = get_stats_window(create_feature_dict, seconds_in_bucket=0 , add_suffix=False ) df_feature_500 = get_stats_window(create_feature_dict, seconds_in_bucket=500 , add_suffix=True ) df_feature_400 = get_stats_window(create_feature_dict, seconds_in_bucket=400 , add_suffix=True ) df_feature_300 = get_stats_window(create_feature_dict, seconds_in_bucket=300 , add_suffix=True ) df_feature_200 = get_stats_window(create_feature_dict, seconds_in_bucket=200 , add_suffix=True ) df_feature_100 = get_stats_window(create_feature_dict, seconds_in_bucket=100 , add_suffix=True ) df_feature = df_feature.merge(df_feature_500, how='left' , left_on='time_id_' , right_on='time_id__500' ) df_feature = df_feature.merge(df_feature_400, how='left' , left_on='time_id_' , right_on='time_id__400' ) df_feature = df_feature.merge(df_feature_300, how='left' , left_on='time_id_' , right_on='time_id__300' ) df_feature = df_feature.merge(df_feature_200, how='left' , left_on='time_id_' , right_on='time_id__200' ) df_feature = df_feature.merge(df_feature_100, how='left' , left_on='time_id_' , right_on='time_id__100' ) df_feature.drop(['time_id__500' , 'time_id__400' , 'time_id__300' , 'time_id__200' , 'time_id__100' ], axis=1 , inplace=True ) stock_id = file_path.split('=' )[1 ] df_feature['row_id' ] = df_feature['time_id_' ].apply(lambda x: f'{stock_id} -{x} ' ) df_feature.drop(['time_id_' ], axis=1 , inplace=True ) return df_feature
我们逐一来看特征构建过程:
df['wap1']这类就是计算wap,都利用的是公式2。对应着如下4个计算函数(这里贴出所有特征处理函数):
1 2 3 4 5 6 7 8 9 10 11 12 13 14 15 16 17 18 19 20 21 22 23 24 25 26 27 28 29 30 31 32 33 34 35 def calc_wap1 (df ): """Weighted averaged price权重平均买卖价1""" wap1 = (df['bid_price1' ] * df['ask_size1' ] + df['ask_price1' ] * df['bid_size1' ]) \ / (df['bid_size1' ] + df['ask_size1' ]) return wap1 def calc_wap2 (df ): """权重平均买卖价2""" wap2 = (df['bid_price2' ] * df['ask_size2' ] + df['ask_price2' ] * df['bid_size2' ]) \ / (df['bid_size2' ] + df['ask_size2' ]) return wap2 def calc_wap3 (df ): """权重平均买卖价2""" wap3 = (df['bid_price1' ] * df['bid_size1' ] + df['ask_price1' ] * df['ask_size1' ]) \ / (df['bid_size1' ] + df['ask_size1' ]) return wap3 def calc_wap4 (df ): """权重平均买卖价2""" wap4 = (df['bid_price2' ] * df['bid_size2' ] + df['ask_price2' ] * df['ask_size2' ]) \ / (df['bid_size2' ] + df['ask_size2' ]) return wap4 def log_return (series ): """将输入变为log后对于某一axis寻找差值 log(x/y) = log(x) - log(y)""" return np.log(series).diff() def realized_volatility (series ): """计算实际波动率""" return np.sqrt(np.sum (series**2 )) def count_unique (series ): """计算series中unique数目""" return len (np.unique(series))
实际上如上面df1计算 calc_wap1(df1)后得到:
1 2 3 4 5 6 0 1.001434 1 1.001448 2 1.001448 ... 917552 0.998517 Length: 917553 , dtype: float32
添加四个特征后:
df['log_return1']这类特征也是4个,计算利用的公式3.对上一步得到的特征按 'time_id'分组后应用下面的 log_return计算 'wap1'。
1 2 3 def log_return (series ): """将输入变为log后对于某一axis寻找差值 log(x/y) = log(x) - log(y)""" return np.log(series).diff()
如df1计算第一个后:
1 2 3 4 5 6 7 8 9 10 df1.groupby(['time_id' ])['wap1' ].apply(log_return) ==================================================== 0 NaN1 0.000014 2 0.000000 3 -0.000005 ... 917551 0.000001 917552 0.000000 Name: wap1, Length: 917553 , dtype: float32
这时df1又会得到四个特征log_return
在后面代码中我们还会对这4个特征求[realized_volatility]来构建特征(利用公式4):
1 2 3 def realized_volatility (series ): """计算实际波动率""" return np.sqrt(np.sum (series**2 ))
剩下的如 'wap_balance'、'price_spread'等8个特征也如源码计算。这样处理后,df1.head()后面特征如下:
接下来构建统计信息的特征字典, np.sum, np.std. 注意与后面一个以时间构建实际波动率的字典create_feature_dict_time区分。
然后是get_stats_window(*fe_dict*, *seconds_in_bucket*, *add_suffix*=False)方法会将4中处理得到的特征字典作为 fe_dict,按照 'seconds_in_bucket'区间大于0, 500…时间段内合计对应 fe_dict信息后 reset_index()。df['seconds_in_bucket'] >= seconds_in_bucket]如果 seconds_in_bucket=0,那么就是选取df1中df['seconds_in_bucket']>0部分来按照 create_feature_dictagg各特征的统计信息如:
将上面列名整理下:
1 2 3 4 5 df1_feature.columns = ['_' .join(col) for col in df1_feature.columns] df1_feature.columns ==================================================== ['wap1_sum' , 'wap1_std' , 'wap2_sum' , 'wap2_std' , 'wap3_sum' , 'wap3_std' , 'wap4_sum' , 'wap4_std' , 'log_return1_realized_volatility' ,]
再加上需要后缀就是 get_stats_window作用了。
如果是 df1['seconds_in_bucket']>500 那么使用 create_feature_dict_time构建特征。一样操作,形成:
1 2 df1_feature = df1[df1['seconds_in_bucket' ]>500 ].groupby(['time_id' ]).agg(create_feature_dict_time).head() df1_feature
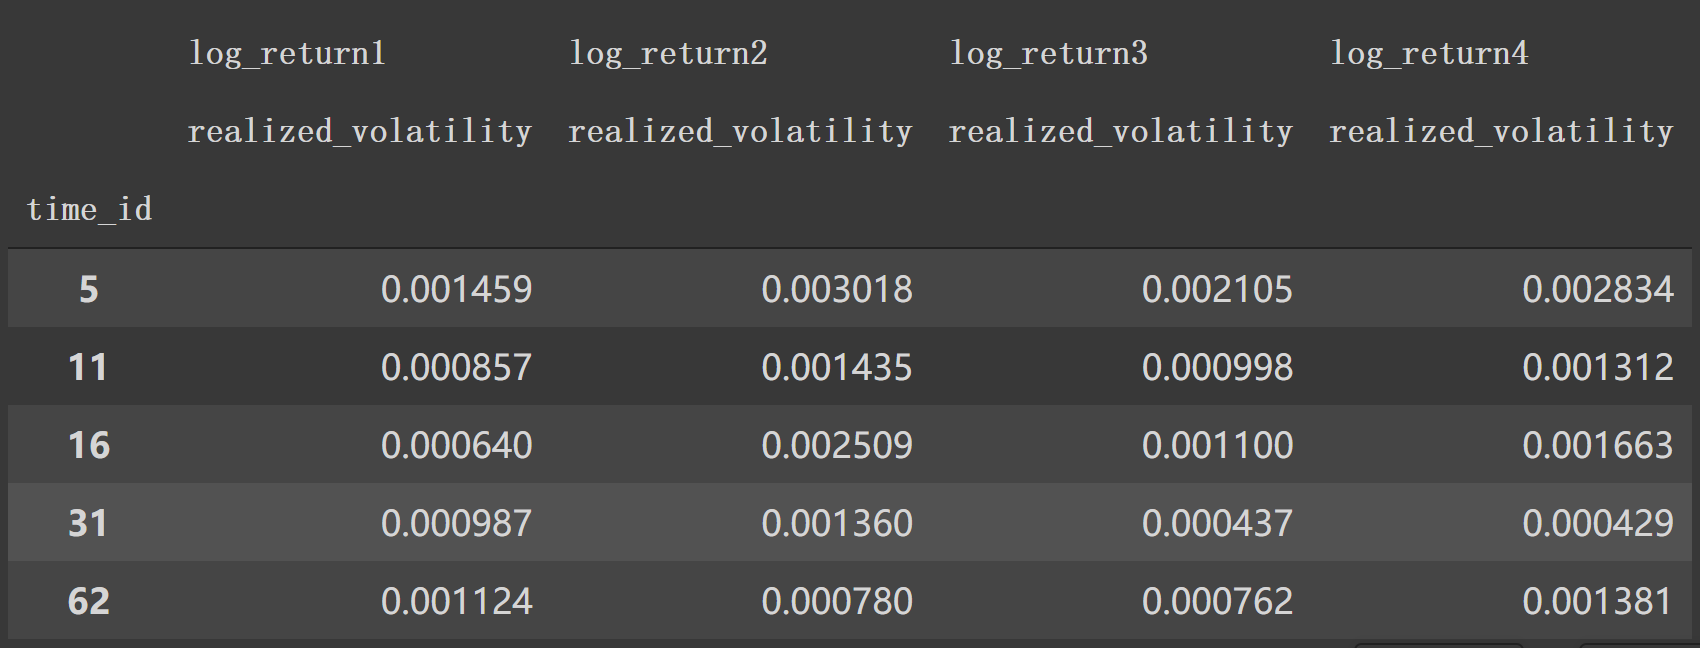
最后形成时间段波动率如:
1 2 df1_feature_500 = get_stats_window(create_feature_dict_time, 500 , True ) df1_feature_500.head()
接下来就是简单的合并特征丢掉不需要的特征和构建新 'row_id',最后返回整个特征df。
1 2 df1_feature = df1_feature.merge(df1_feature_500, how='left' , left_on='time_id_' , right_on='time_id__500' ) df1_feature.head()
就以df1_feature有的行拼接 df1_feature_500, 左边以 'time_id_'为index, 右边以 'time_id__500',逐一合并。
特征列完整后接:
接下来就是踢掉不必要的列:
1 2 df1_feature.drop(['time_id__500' , 'time_id__400' , 'time_id__300' , 'time_id__200' , 'time_id__100' ], axis=1 , inplace=True ) df1_feature.head()
至于获取stock_id, 就很简单了,如 stock_id = str("/content/work/data/book_train.parquet/stock_id=0").split('=')[1],这里就是0.
那么,df1_feature['row_id']应该是这个样子的 0-5, 0-11,就是stock_id-time_id_
1 2 df1_feature['row_id' ] = df1_feature['time_id_' ].apply(lambda x: f'{stock_id} -{x} ' ) df1_feature.head()
最后返回的特征df尾部就像这样:
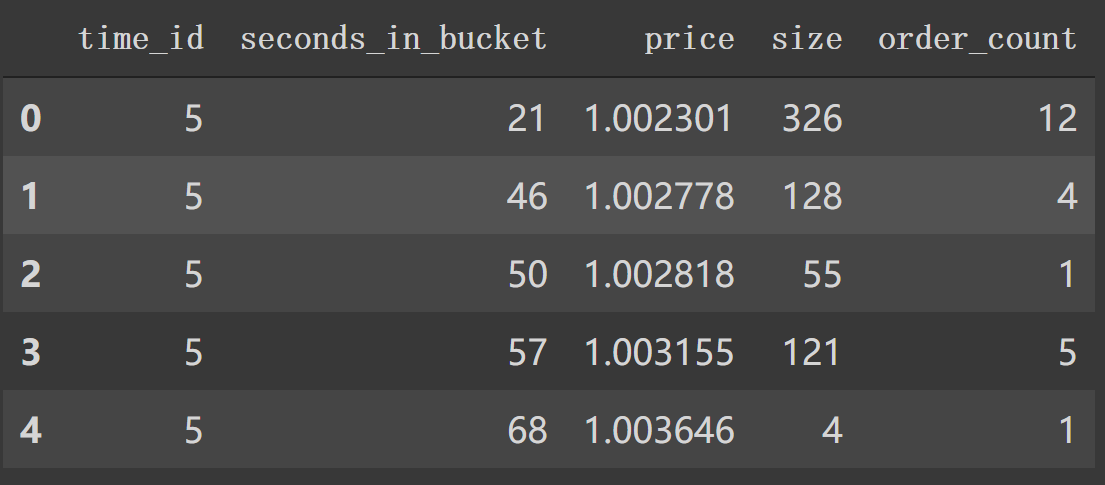
4. trade_preprocessor逐行 第一句同样是 df = pd.read_parquet(file_path),test只有stock_id=0我们看看其信息,比较下跟book的区别。
1 2 df2 = pd.read_parquet('/content/work/data/trade_train.parquet/stock_id=0' ) df2.head()
下面是整个 trade_preprocessor,后面会逐行解释。
1 2 3 4 5 6 7 8 9 10 11 12 13 14 15 16 17 18 19 20 21 22 23 24 25 26 27 28 29 30 31 32 33 34 35 36 37 38 39 40 41 42 43 44 45 46 47 48 49 50 51 52 53 54 55 56 57 58 59 60 61 62 63 64 65 66 67 68 69 70 71 72 73 74 75 76 77 78 79 80 81 82 83 84 85 86 87 88 89 90 91 92 93 94 95 96 97 98 99 def trade_preprocessor (file_path ): df = pd.read_parquet(file_path) df['log_return' ] = df.groupby('time_id' )['price' ].apply(log_return) df['amount' ] = df['price' ] * df['size' ] create_feature_dict = { 'log_return' : [realized_volatility], 'seconds_in_bucket' : [count_unique], 'size' : [np.sum , np.max , np.min ], 'order_count' : [np.sum , np.max ], 'amount' : [np.max , np.max , np.min ], } create_feature_dict_time = { 'log_return' : [realized_volatility], 'seconds_in_bucket' : [count_unique], 'size' : [np.sum ], 'order_count' : [np.sum ], } def get_stats_window (fe_dict, seconds_in_bucket, add_suffix=False ): """按时间段以及time_id聚合特征,bucket:时间段""" df_feature = df[df['seconds_in_bucket' ] >= seconds_in_bucket] \ .groupby(['time_id' ]).agg(fe_dict).reset_index() df_feature.columns = ['_' .join(col) for col in df_feature.columns] if add_suffix: df_feature = df_feature.add_suffix('_' + str (seconds_in_bucket)) return df_feature df_feature = get_stats_window(create_feature_dict, seconds_in_bucket=0 , add_suffix=False ) df_feature_500 = get_stats_window(create_feature_dict_time, seconds_in_bucket=500 , add_suffix=True ) df_feature_400 = get_stats_window(create_feature_dict_time, seconds_in_bucket=400 , add_suffix=True ) df_feature_300 = get_stats_window(create_feature_dict_time, seconds_in_bucket=300 , add_suffix=True ) df_feature_200 = get_stats_window(create_feature_dict_time, seconds_in_bucket=200 , add_suffix=True ) df_feature_100 = get_stats_window(create_feature_dict_time, seconds_in_bucket=100 , add_suffix=True ) def tendency (price, vol ): """趋势计算""" df_diff = np.diff(price) val = (df_diff / price[1 :]) * 100 power = np.sum (val * vol[1 :]) return (power) lis = [] for n_time_id in df['time_id' ].unique(): df_id = df[df['time_id' ]==n_time_id] tendencyV = tendency(df_id['price' ].values, df_id['size' ].values) f_max = np.sum (df_id['price' ].values > np.mean(df_id['price' ].values)) f_min = np.sum (df_id['price' ].values < np.mean(df_id['price' ].values)) df_max = np.sum (np.diff(df_id['price' ].values) > 0 ) df_min = np.sum (np.diff(df_id['price' ].values) < 0 ) abs_diff = np.median(np.abs (df_id['price' ].values - np.mean(df_id['price' ].values))) energy = np.mean(df_id['price' ].values**2 ) iqr_p = np.percentile(df_id['price' ].values, 75 ) - np.percentile(df_id['price' ].values, 25 ) abs_diff_v = np.median(np.abs (df_id['size' ].values - np.mean(df_id['size' ].values))) energy_v = np.sum (df_id['size' ].values ** 2 ) iqr_p_v = np.percentile(df_id['size' ].values, 75 ) - np.percentile(df_id['size' ].values, 25 ) lis.append({'time_id' : n_time_id, 'tendency' : tendencyV, 'f_max' : f_max,\ 'f_min' : f_min, 'df_max' : df_max, 'df_min' : df_min,\ 'abs_diff' : abs_diff, 'energy' : energy, 'iqr_p' : iqr_p,\ 'abs_diff_v' : abs_diff_v, 'energy_v' : energy_v, 'iqr_p_v' : iqr_p_v}) df_lr = pd.DataFrame(lis) df_feature = df_feature.merge(df_lr, how='left' , left_on='time_id_' , right_on='time_id' ) df_feature = df_feature.merge(df_feature_500, how='left' , left_on='time_id_' , right_on='time_id__500' ) df_feature = df_feature.merge(df_feature_400, how='left' , left_on='time_id_' , right_on='time_id__400' ) df_feature = df_feature.merge(df_feature_300, how='left' , left_on='time_id_' , right_on='time_id__300' ) df_feature = df_feature.merge(df_feature_200, how='left' , left_on='time_id_' , right_on='time_id__200' ) df_feature = df_feature.merge(df_feature_100, how='left' , left_on='time_id_' , right_on='time_id__100' ) df_feature.drop(['time_id__500' , 'time_id__400' , 'time_id__300' , 'time_id__200' ,\ 'time_id' , 'time_id__100' ], axis=1 , inplace=True ) df_feature = df_feature.add_prefix('trade_' ) stock_id = file_path.split('=' )[1 ] df_feature['row_id' ] = df_feature['trade_time_id_' ].apply(lambda x: f'{stock_id} -{x} ' ) df_feature.drop(['trade_time_id_' ], axis=1 , inplace=True ) return df_feature
先开始构建两个新特征: 'log_return'按time_id计算价格的log_return,'amount'.这时,df如下所示:
跟book_preprocessor类似地构建两个特征字典:create_feature_dict, create_feature_dict_time.其中第二个字典中 count_unique计算方法如下:
1 2 3 def count_unique (series ): """计算series中unique数目""" return len (np.unique(series))
如:
1 2 df2_feature = df2[df2['seconds_in_bucket' ] >= 0 ].groupby(['time_id' ]).agg(create_feature_dict).reset_index() df2_feature.head()
_seconds_in_bucket后缀。
1 2 3 df2_feature.columns = ['_' .join(col) for col in df2_feature.columns] df2_feature.head()
接下来也跟book_preprocessor中一样构建窗口特征信息。如:
1 2 df2_feature_500 = get_stats_window(create_feature_dict_time, 500 , True ) df2_feature_500.head()
用价格和数量计算 tendency(price, vol)。
1 2 3 4 5 def tendency (price, vol ): df_diff = np.diff(price) val = (df_diff/price[1 :])*100 power = np.sum (val*vol[1 :]) return (power)
就是求价格变化百分比乘以数量累加值。
按时间id计算trade特征,如 tendencyV等,作为字典都添加到lis列表中。然后得到 df_lr = pd.DataFrame(lis)这个新的df。df_id一个特例信息如下:
1 2 3 4 5 6 [i for i in df2['time_id' ].unique()][:5 ] =========================================== [5 , 11 , 16 , 31 , 62 ] df2_id = df2[df2['time_id' ] == 5 ] df2_id.head()
tendencyV = tendency(df_id['price'].values, df_id['size'].values)这个特征构建中,就是取price, size的值,经过tendency方法计算与前一个 seconds_in_bucket差值后得到其差值百分比后乘以对应数量,最后得到变化总和。其它特征也类似构建,最后形成lis列表,转换成新特征 df_lr。
你可以将整个这部分转换为一个方法,df作为输入,看看df_lr具体情况:(为了简洁将中间部分省去了。)
1 2 3 4 5 6 7 8 def lis_df_lr (df ): lis = [] for n_time_id in df['time_id' ].unique(): ... df_lr = pd.DataFrame(lis) return df_lr df2_lr = lis_df_lr(df2) df2_lr.head()
先跟df_lr合并再合并所有窗口特征信息 df_feature_500…。
1 2 df2_feature = df2_feature.merge(df2_lr, how='left' , left_on='time_id_' , right_on='time_id' ) df2_feature.head()
最后就是特征添加前缀 'trade_', 构建新的 'row_id',最后返回df_feture.
1 2 3 4 df2_feature = df2_feature.add_prefix('trade_' ) df2_feature['row_id' ] = df2_feature['trade_time_id_' ].apply(lambda x:f'{str (0 )} -{x} ' ) df2_feature.drop(['trade_time_id_' ], axis = 1 , inplace = True ) df2_feature.head()
最后特征df部分信息如下:
5.get_time_stock 1 2 3 4 5 6 7 8 9 10 11 12 13 14 15 16 17 18 19 20 21 22 23 24 25 26 27 28 29 30 31 def get_time_stock (df ): """ df中实际波动率realized_volatility相关列分别按 stock_id/time_id分组后聚合求统计指标 然后跟原df合并 """ vol_cols = ['log_return1_realized_volatility' , 'log_return2_realized_volatility' ,\ 'log_return1_realized_volatility_400' , 'log_return2_realized_volatility_400' ,\ 'log_return1_realized_volatility_300' , 'log_return2_realized_volatility_300' ,\ 'log_return1_realized_volatility_200' , 'log_return2_realized_volatility_200' ,\ 'trade_log_return_realized_volatility' , 'trade_log_return_realized_volatility_400' ,\ 'trade_log_return_realized_volatility_300' , 'trade_log_return_realized_volatility_200' , ] df_stock_id = df.groupby(['stock_id' ])[vol_cols].agg(['mean' , 'std' , 'max' , 'min' , ]).reset_index() df_stock_id.columns = ['_' .join(col) for col in df_stock_id.columns] df_stock_id = df_stock_id.add_suffix('_' + 'stock' ) df_time_id = df.groupby(['time_id' ])[vol_cols].agg(['mean' , 'std' , 'max' , 'min' , ]).reset_index() df_time_id.columns = ['_' .join(col) for col in df_time_id.columns] df_time_id = df_time_id.add_suffix('_' + 'time' ) df = df.merge(df_stock_id, how='left' , left_on=['stock_id' ], right_on=['stock_id__stock' ]) df = df.merge(df_time_id, how='left' , left_on=['time_id' ], right_on=['time_id__time' ]) df.drop(['stock_id__stock' , 'time_id__time' ], axis=1 , inplace=True ) return df
实际调用过程中是这部分:
1 2 3 4 5 6 7 8 9 10 11 12 13 train, test = read_train_test_data() train_stock_id = train['stock_id' ].unique() train_ = preprocessor(train_stock_id, is_train=True ) train = train.merge(train_, on=['row_id' ], how='left' ) test_stock_id = test['stock_id' ].unique() test_ = preprocessor(train_stock_id, is_train=True ) test = test.merge(test_, on=['row_id' ], how='left' ) train = get_time_stock(train) test = get_time_stock(test)
这里是得到train, test csv数据后,按 'stock_id'处理得到 train_等进一步merge得到一个我们在第3、4小节构建的整个新特征df。
接下来我们按照vol_cols列表中的特征列(这些特征都是df中表示 realized_volatility的,我也不知道为什么会扔掉部分,如return2这种,可能是已经怕特征冗余,或者太多特征处理时间过长)
1 2 df_stock_id = train.groupby(['stock_id' ])[vol_cols].agg(['mean' , 'std' , 'max' , 'min' ]).reset_index() df_stock_id.head()
这时候df_stock_id变成:
将index连起来添加个后缀:
1 2 3 df_stock_id.columns = ['_' .join(col) for col in df_stock_id.columns] df_stock_id = df_stock_id.add_suffix('_' + 'stock' ) df_stock_id.head()
同样按time_id处理得到 df_time_id:
接下来就是合并得到整个df了,如train.head():
test.head()如下:
接下来是利用 'trade_seconds_in_bucket_count_unique'继续构建新的特征:
1 2 3 4 5 6 7 8 9 10 11 12 train['size_tau' ] = np.sqrt(1 /train['trade_seconds_in_bucket_count_unique' ]) test['size_tau' ] = np.sqrt(1 /test['trade_seconds_in_bucket_count_unique' ]) train['size_tau_400' ] = np.sqrt(1 /train['trade_seconds_in_bucket_count_unique_400' ]) test['size_tau_400' ] = np.sqrt(1 /test['trade_seconds_in_bucket_count_unique_400' ]) train['size_tau_300' ] = np.sqrt(1 /train['trade_seconds_in_bucket_count_unique_300' ]) test['size_tau_300' ] = np.sqrt(1 /test['trade_seconds_in_bucket_count_unique_300' ]) train['size_tau_200' ] = np.sqrt(1 /train['trade_seconds_in_bucket_count_unique_200' ]) test['size_tau_200' ] = np.sqrt(1 /test['trade_seconds_in_bucket_count_unique_200' ])
同样利用 'trade_order_count_sum'构建新特征:
1 2 3 4 5 6 7 8 9 10 11 12 13 14 15 16 train['size_tau2' ] = np.sqrt(1 /train['trade_order_count_sum' ]) test['size_tau2' ] = np.sqrt(1 /test['trade_order_count_sum' ]) train['size_tau2_400' ] = np.sqrt(0.33 /train['trade_order_count_sum' ]) test['size_tau2_400' ] = np.sqrt(0.33 /test['trade_order_count_sum' ]) train['size_tau2_300' ] = np.sqrt(0.5 /train['trade_order_count_sum' ]) test['size_tau2_300' ] = np.sqrt(0.5 /test['trade_order_count_sum' ]) train['size_tau2_200' ] = np.sqrt(0.66 /train['trade_order_count_sum' ]) test['size_tau2_200' ] = np.sqrt(0.66 /test['trade_order_count_sum' ]) train['size_tau2_d' ] = train['size_tau2_400' ] - train['size_tau2' ] test['size_tau2_d' ] = test['size_tau2_400' ] - test['size_tau2' ]
现在特征列:
1 2 3 colNames = [col for col in list (train.columns) if col not in {"stock_id" , "time_id" , "target" , "row_id" }] len (colNames)
3.Kmeans聚类构建特征 在第一篇中,我们得到了特征工程后的train, test df。现在采用kmeans聚类的方式,按相似股票聚合,并计算以上特征的平均值作为新的特征。。
1 2 3 4 5 6 7 8 9 10 11 12 13 14 15 16 17 18 19 20 from sklearn.cluster import KMeanstrain_p = pd.read_csv(data_dir + 'train.csv' ) train_p = train_p.pivot(index='time_id' , columns='stock_id' , values='target' ) corr = train_p.corr() ids = corr.index kmeans = KMeans(n_clusters=7 , random_state=SEED).fit(corr.values) print (kmeans.labels_)========================================================================== [0 5 3 2 0 0 2 3 1 2 0 5 3 3 0 0 0 2 3 3 3 5 0 0 6 0 0 3 6 3 0 3 3 0 6 6 3 6 3 0 3 0 3 3 0 5 3 3 3 5 5 6 6 6 2 5 2 3 0 3 3 0 3 0 5 6 2 5 6 5 1 4 6 5 5 0 2 5 6 6 5 3 0 0 5 2 6 6 0 5 0 3 3 3 3 0 0 6 0 5 0 3 0 5 0 3 0 5 3 5 3 5 ] l = [] for n in range (7 ): l.append([(x-1 ) for x in ((ids+1 ) * (kmeans.labels_==n)) if x > 0 ])
这里依次用train的透视表重构特征后的相关系数值进行聚类,然后用((ids+1) * (kmeans.labels_==n))得到各类别对应索引的列表l。
1 2 3 4 5 6 7 8 9 10 11 12 13 14 15 16 17 18 19 20 21 22 23 24 25 mat = [] matTest = [] n = 0 for ind in l: print (ind) newDf = train.loc[train['stock_id' ].isin(ind)] newDf = newDf.groupby(['time_id' ]).agg(np.nanmean) newDf.loc[:, 'stock_id' ] = str (n) + 'c1' mat.append(newDf) newDf = test.loc[test['stock_id' ].isin(ind)] newDf = newDf.groupby(['time_id' ]).agg(np.nanmean) newDf.loc[:, 'stock_id' ] = str (n) + 'c1' matTest.append(newDf) n += 1 ======================================================================================= [0 , 4 , 5 , 10 , 15 , 16 , 17 , 23 , 26 , 28 , 29 , 33 , 36 , 42 , 44 , 48 , 66 , 69 , 72 , 85 , 94 , 95 , 100 , 102 , 108 , 109 , 111 , 113 , 115 , 118 , 120 ] [8 , 80 ] [3 , 6 , 9 , 18 , 61 , 63 , 75 , 86 , 97 ] [2 , 7 , 13 , 14 , 19 , 20 , 21 , 30 , 32 , 34 , 35 , 39 , 41 , 43 , 46 , 47 , 51 , 52 , 53 , 64 , 67 , 68 , 70 , 93 , 103 , 104 , 105 , 107 , 114 , 119 , 123 , 125 ] [81 ] [1 , 11 , 22 , 50 , 55 , 56 , 62 , 73 , 76 , 78 , 83 , 84 , 87 , 90 , 96 , 101 , 112 , 116 , 122 , 124 , 126 ] [27 , 31 , 37 , 38 , 40 , 58 , 59 , 60 , 74 , 77 , 82 , 88 , 89 , 98 , 99 , 110 ]
接下来是对生成的matrix进行转换:
1 2 3 4 5 6 7 8 9 10 11 12 13 14 15 mat1 = pd.concat(mat).reset_index() mat1.drop(columns=['target' ], inplace=True ) mat2 = pd.concat(matTest).reset_index() mat2 = pd.concat([mat2, mat1.loc[mat1.time_id==5 ]]) mat1 = mat1.pivot(index='time_id' , columns='stock_id' ) mat1.columns = ['_' .join(x) for x in mat1.columns.ravel()] mat1.reset_index(inplace=True ) mat2 = mat2.pivot(index='time_id' , columns='stock_id' ) mat2.columns = ['_' .join(x) for x in mat2.columns.ravel()] mat2.reset_index(inplace=True )
上面代码如mat1 = mat1.pivot(index='time_id', columns='stock_id')中mat1如下:
拼接下列名 mat1.columns = ['_'.join(x) for x in mat1.columns.ravel()]:
然后就是选取一些特征继续合并:
1 2 train = pd.merge(train, mat1[nnn], how='left' , on='time_id' ) test = pd.merge(test, mat2[nnn], how='left' , on='time_id' )
这就是所有特征工程的内容了,真的服了alexioslyon大神的能力。接下来可以使用LGBM和NN、CNN等模型来预测target。你可以把test,train 用train.to_pickle(‘path’)保存下来,方便下次使用。
Inference [1] optiver-realized-volatility-prediction
[2] 股市交易的撮合机制究竟是怎么运行的?
[3] Optiver Realized Volatility Prediction


